

The key role of markets is to convey information through price discovery. Market participants take in data, then assess that data’s impact on particular securities or commodities prices, and, in turn, other participants can use that price information to make decisions. Whether it is the impact of weather on the supply and demand of orange juice, or management’s strategy for a business, information is digested and reflected in price, so others can then make their own decisions. Of course, markets will over- or under-react to specific events and short-term issues, but price discovery is usually correct over time.
Sometimes the price discovery process needs to send messages to larger entities. This is what is known as “Market Vigilantes,” most notably the “Bond Market Vigilantes.” This refers to the bond market sending a signal to lenders (in this case, the U.S. government) that policy may need to change. The Bond Market Vigilantes were busy sending messages after the tariffs were announced on April 2.
Over the course of that weekend, several prominent business leaders in the Republican sphere spoke out on the risk of tariffs, including Bill Ackman, Ken Griffin, Ray Dalio, and the number one advisor, Elon Musk. Behind the scenes, cabinet members such as Treasury Secretary Bessent, Commerce Secretary Lutnick, USTR Greer and Senior Counselor for Trade and Manufacturing Navarro continued the ongoing policy debate that had created the original tariff schedule.
But it was the markets that shifted the policy: In particular, the bond market, as the message of Trump’s advisors was amplified by the market’s moves. A two-day, 10% S&P pullback to end the week started to get their attention, but the gyrations of the bond market the following week were truly notable. During the first two days after the announcement, bonds behaved “normally,” meaning as investors went “risk off” in stocks, they bought bonds, causing rates to fall and bond prices to rise. Yields reached as low as 3.90% on Friday, April 4.
But then things shifted, with the 10yr yield rising from 3.90% Monday morning, to a high of 4.50% early on Wednesday. This was the biggest three-day jump in the 10yr since 2001, causing bond prices to drop while stock prices were still down.
Market observers cited several possible drivers. It could have been market internals of hedge funds and other levered investors being forced to sell bonds to close out positions. It could have been the economic implications of investors looking at the inflation impact of tariffs and deciding interest rates would be higher going forward. It could have been a combination of markets and economics as Chinese and other foreign bondholders sold, because the shift in trade patterns suggested they might not need to buy as many bonds (trade deficit proceeds usually end up in U.S. Treasuries). Regardless of the reason, the U.S. Treasury market, the deepest and most liquid market in the world, was starting to break down. When the Treasury market starts to lose liquidity, it’s a sign markets are in deep stress. Similar instances occurred in late 2008 and early 2009 amidst the Global Financial Crisis, as well is in March 2020 when COVID was emerging as a threat to the global economy.
The Bond Market Vigilantes were sending a strong message, and this unusual market action was specifically cited by President Trump when, mid-day on Wednesday, he announced that there would be a 90-day pause on the reciprocal tariffs for every country except China (although the 10% universal rate remains).
What can our models tell us about the bond market as of April 11, after its three-day meltdown?Our interest rate model lends insight into the risks, and thinking, of the bond market over the past few weeks.
Assuming 2% inflation and 2% trend growth (the Fed’s two long-term assumptions), we model a 4% neutral interest rate, bracketed by a 50 bps 3.75% to 4.25% neutral range. Second, we look at the 2yr yield as a proxy for Fed policy, and the 10yr yield as a proxy for the economy. Based on where the 2yr is relative to our neutral range, we can gauge the market’s view of Fed policy, while the 10yr shows what type of economy the market is pricing.
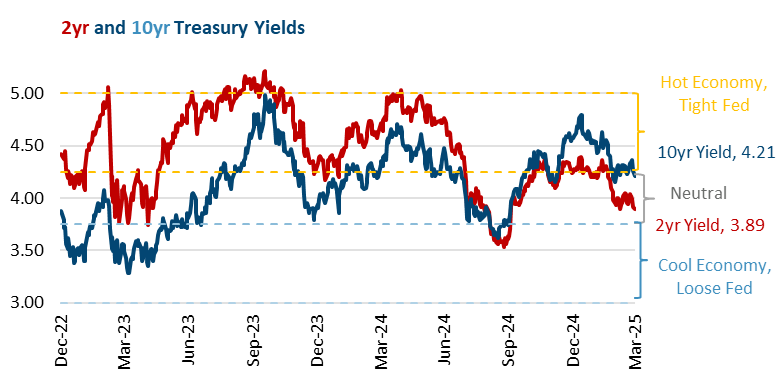
Chart 1 shows these two rates, as well as an orange “Hot Economy, Tight Fed” range of 4.25% to 5.00%, and a blue “Cool Economy, Loose Fed” range of 3.00% to 3.75%.
As of the end of Q1, the 10yr (at 4.21%, near the breakpoint between a “Neutral” and “Hot Economy”) and 2yr (at 3.89%, within the “Neutral” range for Fed policy) were at sensible levels.
After volatility to start the quarter, the 10yr was as low as 3.90% on April 4, but then rocketed to nearly 4.5% intraday on Wednesday before the 90-day tariff delay was announced. In the same period, the 2yr reached as low as 3.50% and as high as 4.00%, settling at 3.94% as of the close on April 11. Growth risks pushed it to 3.9%, in the “Neutral” range, and headed towards “Cool,” in typical risk-off fashion, while a 10yr yield of 4.50% is in the middle of our “Hot Economy” range. If growth is at risk of dropping, what would push rates up? Tariffs threaten to raise prices of imports, which would raise inflation. This was the main source of upward rate pressure, from an economic standpoint.
The 2yr Treasury move from 3.50% “Loose Fed” to near 4% “Neutral Fed” reflected the Fed seeing the same risk of inflation and, rather than cutting rates to support the economy, holding them steady. Combined, higher 10yr and 2yr rates, despite a weakening economy, is unnerving, as it shows markets are thinking about stagflation (slow growth and high inflation), a tough combination for the Fed to fix.
After this backup in rates undermined bond returns at the exact time they should have been supporting portfolio returns, there is one modest positive: From April 11 forward, interest rates are in a better position to support portfolio returns if the tariff risk to higher inflation subsides.
For valuing bonds, one metric we focus on is the ratio of Duration to Yield. Duration measures the sensitivity of a bond’s price to changes in interest rates, with the value representing the percent change in a bond’s price for a 1% change in rates. For example, a bond with a duration of five would lose 5% if interest rates rose 1%.
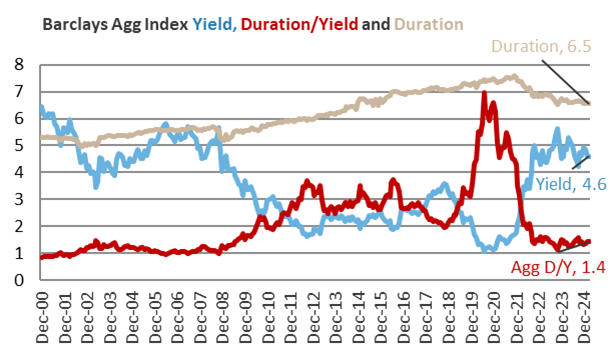
Chart 2
What do valuations say about the appeal of bonds at this interest rate level? Before the Global Financial Crisis in 2009, this ratio was in a range of 1.0 to 1.4, so we view that as “normal.” At 1.4, the Duration/Yield ratio is still in that reasonable range (see Chart 2).
On April 4, after the initial risk off move in bonds pushed rates down, the Agg had a 4.46% yield that, with a 6.5 duration, made a 1.45 Duration/Yield ratio. As of April 11, after bond yields backed up, the Agg yield was 40 bps higher, at 4.86%, knocking it down to 1.34. This may not seem like much, but that 40 bps move equates to about 2.5% of return, a notable loss for three days. But with Duration/Yield lower and, should tariff headlines (and time) allow the bond market to settle down, then this higher level should allow bonds to perform better as the quarter progresses.
Assuming policymakers heard the Bond Market Vigilantes Send a Message, then this period of highly unusual bond market activity could fade, ideally driven by progress on trade. This would allow bonds to return to doing their job of providing consistent income and portfolio price stability.
See Also:
- 3/31/25 Outlook Theme #1: Stop and Go Tariffs
- 3/31/25 Focal Point: What Do Stocks Discount?
- Keep a Long-Term Perspective During Dark Days
Important Disclosures:
Please remember that past performance is no guarantee of future results. Different types of investments involve varying degrees of risk, and there can be no assurance that the future performance of any specific investment, investment strategy, or product (including the investments and/or investment strategies recommended or undertaken by Grimes & Company, LLC [“Grimes]), or any non-investment related content, made reference to directly or indirectly in this commentary will be profitable, equal any corresponding indicated historical performance level(s), be suitable for your portfolio or individual situation, or prove successful. Due to various factors, including changing market conditions and/or applicable laws, the content may no longer be reflective of current opinions or positions. Moreover, you should not assume that any discussion or information contained in this commentary serves as the receipt of, or as a substitute for, personalized investment advice from Grimes. No amount of prior experience or success should not be construed that a certain level of results or satisfaction if Grimes is engaged, or continues to be engaged, to provide investment advisory services. Grimes is neither a law firm, nor a certified public accounting firm, and no portion of the commentary content should be construed as legal or accounting advice. A copy of the Grimes’ current written disclosure Brochure discussing our advisory services and fees continues to remain available upon request or at www.grimesco.com. Please Remember: If you are a Grimes client, please contact Grimes, in writing, if there are any changes in your personal/financial situation or investment objectives for the purpose of reviewing/evaluating/revising our previous recommendations and/or services, or if you would like to impose, add, or to modify any reasonable restrictions to our investment advisory services. Unless, and until, you notify us, in writing, to the contrary, we shall continue to provide services as we do currently. Please Also Remember to advise us if you have not been receiving account statements (at least quarterly) from the account custodian. Historical performance results for investment indices, benchmarks, and/or categories have been provided for general informational/comparison purposes only, and generally do not reflect the deduction of transaction and/or custodial charges, the deduction of an investment management fee, nor the impact of taxes, the incurrence of which would have the effect of decreasing historical performance results. It should not be assumed that your Grimes account holdings correspond directly to any comparative indices or categories. Please Also Note: (1) performance results do not reflect the impact of taxes; (2) comparative benchmarks/indices may be more or less volatile than your Grimes accounts; and, (3) a description of each comparative benchmark/index is available upon request.
The information contained herein is based upon sources believed to be true and accurate. Sources include: Factset Research Systems Inc., Bureau of Economic Analysis, Bureau of Labor Statistics, Congressional Budget Office, Board of Governors of Federal Reserve System, Fred: Federal Reserve Bank of St. Louis Economic Research, U.S. Department of the Treasury
-The Standard & Poor’s 500 is a market capitalization weighted index of 500 widely held domestic stocks often used as a proxy for the U.S. stock market. The Standard & Poor’s 400 is a market capitalization weighted index of 400 mid cap domestic stocks. The Standard & Poor’s 600 is a market capitalization weighted index of 600 small cap domestic stocks.
-The NASDAQ Composite Index measures the performance of all issues listed in the NASDAQ stock market, except for rights, warrants, units, and convertible debentures.
-The MSCI EAFE Index (Europe, Australasia, Far East) is a free float-adjusted market capitalization index that is designed to measure the equity market performance of developed markets, excluding the US & Canada. The MSCI Emerging Markets Index is a free float-adjusted market capitalization index that is designed to measure equity market performance of 21 emerging markets. The MSCI All Country World Index is a free float adjusted market capitalization index designed to measure the performance of large and mid and cap stocks in 23 developed markets and 24 emerging markets. With over 2,800 constituents it represents over 85% of the global equity market.
-The Barlcays Aggregate Index represents the total return performance (price change and income) of the US bond market, including Government, Agency, Mortgage and Corporate debt.
-The BofA Merrill Lynch Investment Grade and High Yield Indices are compiled by Bank of America / Merrill Lynch from the TRACE bond pricing service and intended to represent the total return performance (price change and income) of investment grade and high yield bonds.
-The S&P/LSTA U.S. Leveraged Loan 100 is designed to reflect the largest facilities in the leveraged loan market. It mirrors the market-weighted performance of the largest institutional leveraged loans based upon market weightings, spreads and interest payments.
-The S&P Municipal Bond Index is a broad, comprehensive, market value-weighted index. The S&P Municipal Bond Index constituents undergo a monthly review and rebalancing, in order to ensure that the Index remains current, while avoiding excessive turnover. The Index is rules based, although the Index Committee reserves the right to exercise discretion, when necessary.
-The BofA Merrill Lynch US Emerging Markets External Sovereign Index tracks the performance of US dollar emerging markets sovereign debt publicly issued in the US and eurobond markets.
-The HFRI Fund of Funds index is compiled by the Hedge Funds Research Institute and is intended to represent the total return performance of the entire hedge fund universe.