

The implications of the narrow market were discussed in the 6/30/24 Focal Point: It is Hard to Escape the Impact of the Narrow Market, where returns have been dominated by a small group of large stocks, referred to as the Mag7. This market concentration is evident when comparing the S&P 500 (which is capitalization weighted) to the Equal Weight (EW) S&P 500 (with the same members, but each has an equal 0.2% contribution).
The impact extends beyond just returns. Chart 1 shows the S&P 500 and S&P EW PE ratios, as well as the S&P 500’s premium to the S&P EW (in red, on the right-hand scale). The gap slightly narrowed in Q3’24, but remains relatively wide, at 25%, just below its 31% peak.
While the gap has declined, market concentration is still impacting the broader market.
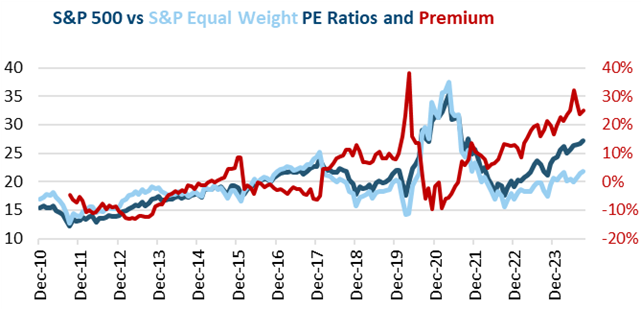
Chart 1
Chart 2 shows the earnings yield on the S&P 500, the yield on the 10yr Treasury, and the difference between the two, known as the Equity Premium. A higher Equity Premium means stock investors are getting more compensation relative to bonds. From 2002 to 2007, prior to the Fed’s QE interventions, a 1-3% Equity Premium was common. Q3’s decline in the 10yr managed to boost the Equity Premium from its end of Q2’24 low of 0.37% to 0.83%. While this is still a low level, it demonstrates how declining interest rates supported Equity prices during the quarter, although the Equity Premium remains low, suggesting stock valuations are stretched.
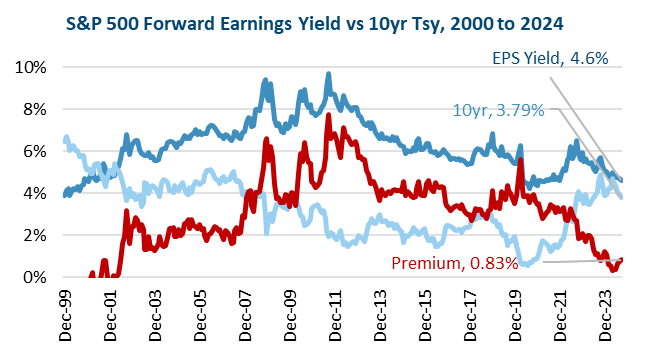
Chart 2
The same analysis can be performed on the other major indices. Chart 3 shows the earnings premiums for the Russell 2000, the MSCI EAFE and MSCI Emerging Markets, along with the S&P 500.
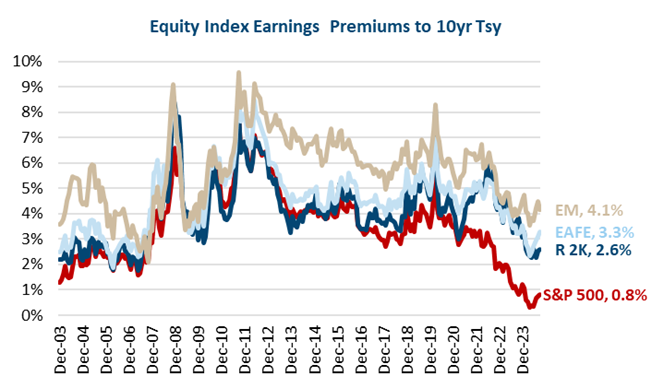
Chart 3
While all four major indices have declined from their unusual levels of 2010-2020, only the S&P 500 is below its 2003-2007 range.
This is evident in the following table.
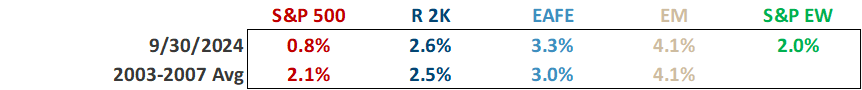
Only the S&P 500 is below its 2003-2007 average. It is also notable that the S&P EW, at 2.0%, is in line with the 2003-2007 S&P 500 average, another indicator that there is a reason to stay diversified and have exposure to stocks beyond the Mag7.
During Q3, the relative outperformance of the S&P Equalweight (+9%) over the S&P 500 (+6%), as well as the Russell 2000 (+9%), MSCI Emerging Markets (+9%) and the MSCI EAFE (+7%), are a small reminder of the benefits of diversification, though all these indices lag the S&P 500 on a YTD basis. Layered on top of the past few years of S&P 500 dominance, this may not always seem evident to investors. Yet the valuation data above shows large parts of the stock market are appealing. On top of that, for the first time in over a decade, bond yields are appealing as well.
The common theme of both Equity and Fixed Income markets is that, after the Fed raised rates and a period of adjustment, the rate backdrop, stock valuations and bond yields are broadly back to pre-GFC levels. On the assumption that the post GFC period (from 2010-2019) was distorted by the Fed’s QE policy artificially depressing interest rates and distorting valuations, this reversion to 2003-2007 levels is a sign Fed policy, and markets, have normalized.
This does not mean every asset class is properly, or perfectly, priced. Depending on the economy’s path, certain asset classes will outperform while others lag. Cumulatively, though, asset classes reflect a reasonable expectation of Fed policy and the economy, and the diversification benefit of various asset classes means a properly constructed portfolio offers reasonable return potential.
This is why Investors can Broaden Their Horizons Beyond the Narrow Market.
Important Disclosures:
Please remember that past performance is no guarantee of future results. Different types of investments involve varying degrees of risk, and there can be no assurance that the future performance of any specific investment, investment strategy, or product (including the investments and/or investment strategies recommended or undertaken by Grimes & Company, Inc. [“Grimes]), or any non-investment related content, made reference to directly or indirectly in this commentary will be profitable, equal any corresponding indicated historical performance level(s), be suitable for your portfolio or individual situation, or prove successful. Due to various factors, including changing market conditions and/or applicable laws, the content may no longer be reflective of current opinions or positions. Moreover, you should not assume that any discussion or information contained in this commentary serves as the receipt of, or as a substitute for, personalized investment advice from Grimes. No amount of prior experience or success should not be construed that a certain level of results or satisfaction if Grimes is engaged, or continues to be engaged, to provide investment advisory services. Grimes is neither a law firm, nor a certified public accounting firm, and no portion of the commentary content should be construed as legal or accounting advice. A copy of the Grimes’ current written disclosure Brochure discussing our advisory services and fees continues to remain available upon request or at www.grimesco.com. Please Remember: If you are a Grimes client, please contact Grimes, in writing, if there are any changes in your personal/financial situation or investment objectives for the purpose of reviewing/evaluating/revising our previous recommendations and/or services, or if you would like to impose, add, or to modify any reasonable restrictions to our investment advisory services. Unless, and until, you notify us, in writing, to the contrary, we shall continue to provide services as we do currently. Please Also Remember to advise us if you have not been receiving account statements (at least quarterly) from the account custodian. Historical performance results for investment indices, benchmarks, and/or categories have been provided for general informational/comparison purposes only, and generally do not reflect the deduction of transaction and/or custodial charges, the deduction of an investment management fee, nor the impact of taxes, the incurrence of which would have the effect of decreasing historical performance results. It should not be assumed that your Grimes account holdings correspond directly to any comparative indices or categories. Please Also Note: (1) performance results do not reflect the impact of taxes; (2) comparative benchmarks/indices may be more or less volatile than your Grimes accounts; and, (3) a description of each comparative benchmark/index is available upon request.
The information contained herein is based upon sources believed to be true and accurate. Sources include: Factset Research Systems Inc., Bureau of Economic Analysis, Bureau of Labor Statistics, Congressional Budget Office, Board of Governors of Federal Reserve System, Fred: Federal Reserve Bank of St. Louis Economic Research, U.S. Department of the Treasury
-The Standard & Poor’s 500 is a market capitalization weighted index of 500 widely held domestic stocks often used as a proxy for the U.S. stock market. The Standard & Poor’s 400 is a market capitalization weighted index of 400 mid cap domestic stocks. The Standard & Poor’s 600 is a market capitalization weighted index of 600 small cap domestic stocks.
-The NASDAQ Composite Index measures the performance of all issues listed in the NASDAQ stock market, except for rights, warrants, units, and convertible debentures.
-The MSCI EAFE Index (Europe, Australasia, Far East) is a free float-adjusted market capitalization index that is designed to measure the equity market performance of developed markets, excluding the US & Canada. The MSCI Emerging Markets Index is a free float-adjusted market capitalization index that is designed to measure equity market performance of 21 emerging markets. The MSCI All Country World Index is a free float adjusted market capitalization index designed to measure the performance of large and mid and cap stocks in 23 developed markets and 24 emerging markets. With over 2,800 constituents it represents over 85% of the global equity market.
-The Barlcays Aggregate Index represents the total return performance (price change and income) of the US bond market, including Government, Agency, Mortgage and Corporate debt.
-The BofA Merrill Lynch Investment Grade and High Yield Indices are compiled by Bank of America / Merrill Lynch from the TRACE bond pricing service and intended to represent the total return performance (price change and income) of investment grade and high yield bonds.
-The S&P/LSTA U.S. Leveraged Loan 100 is designed to reflect the largest facilities in the leveraged loan market. It mirrors the market-weighted performance of the largest institutional leveraged loans based upon market weightings, spreads and interest payments.
-The S&P Municipal Bond Index is a broad, comprehensive, market value-weighted index. The S&P Municipal Bond Index constituents undergo a monthly review and rebalancing, in order to ensure that the Index remains current, while avoiding excessive turnover. The Index is rules based, although the Index Committee reserves the right to exercise discretion, when necessary.
-The BofA Merrill Lynch US Emerging Markets External Sovereign Index tracks the performance of US dollar emerging markets sovereign debt publicly issued in the US and eurobond markets.
-The HFRI Fund of Funds index is compiled by the Hedge Funds Research Institute and is intended to represent the total return performance of the entire hedge fund universe.