

It remains the case that S&P 500 returns are highly concentrated in just a few large stocks, with the Magnificent 7 (Apple, Microsoft, Nvidia, Google, Amazon, Meta, Tesla) accounting for 9% of the S&P 500’s 15% YTD return, or 63%, and all of its Q2 return (the remaining 493 stocks in the S&P 500 were -1% in Q2). Even further, the three stocks with market caps over $3 trillion, Apple, Microsoft and Nvidia, account for 21% of the S&P 500’s market cap, 90% of its Q2 returns (3.5% of 4.3%) and nearly half (6.5% of 15.3%) of the YTD returns.
This trend extended beyond the US to impact global markets. First, the MSCI Emerging Markets index is also impacted by this narrow mega cap technology stock trend. How? The rapid rise of Taiwan Semiconductor, the operator of the semiconductor fabs that make chips for Nvidia and other chip designers. The stock’s market cap of $900b is 10% of the index as of 6/30/24, having risen 27% in Q2’24 and 67% YTD. This single stock accounted for over half of the MSCI Emerging Markets Q2’24 return (2.7% of 5.1%) and two thirds of its YTD return (5% of 7.7%). For both periods, the remaining stocks in the index were up about 2%.
And with the narrow technology stock market impacting both the S&P 500 and the MSCI Emerging Markets indices, the influence can be seen on the global MSCI All Cap World Index (ACWI). The Mag7 stocks plus Taiwan Semiconductor are a combined 22% of the index (or $16 trillion out of $74 trillion) as of 6/30/24. Looking at returns, these eight stocks accounted for all of the MSCI ACWI’s 3% Q2’24 return and just over half of its YTD returns (6.4% of 11.6%). In other words, outside of these stocks, the rest of the global equity markets were down slightly in Q2’24, and up about 5% for 2024 YTD.
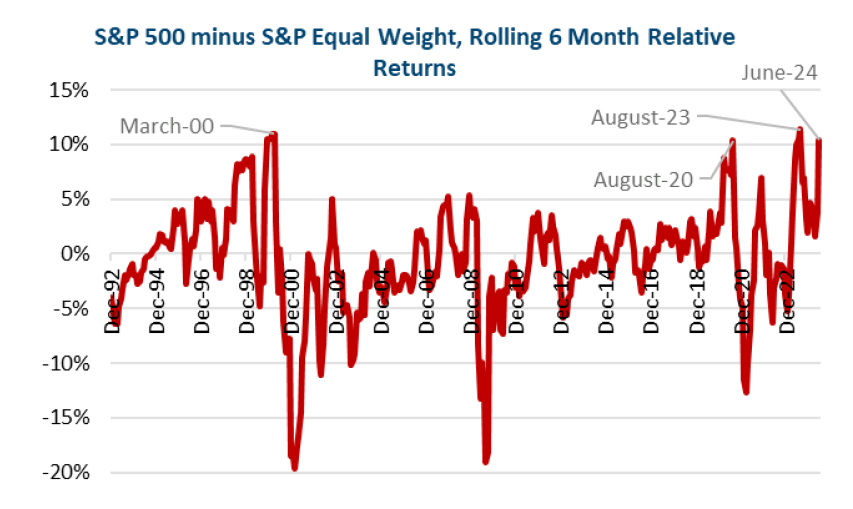
Chart 1
Beyond anecdotal evidence to this particular cycle, longer term this unusual market environment is evident by comparing the S&P 500 (which is capitalization weighted) to the Equal Weight (EW) S&P 500 (with the same members, but each has an equal 0.2% contribution). Looking at rolling 6 month returns in Chart 1, the gap has only exceeded 10% on four occasions since 1992: March 2000 (peak of the dotcom bubble), August 2020 (peak of the covid work-from-home bubble), August 2023 and June 2024.
There are three observations. First, all three prior cases were amidst periods of new technology excitement. Second, three of the four occasions over the past 30 years have been just in the past four years, a sign of how concentrated the market has become. Third, in all three of the prior cases the trend reversed, and the Equal Weight outperformed.
This means that despite the apparent lack of a need to diversify portfolios, it is a good idea to maintain exposure to the other 493 stocks in the S&P 500, let alone the other 2,752 in the MSCI ACWI.
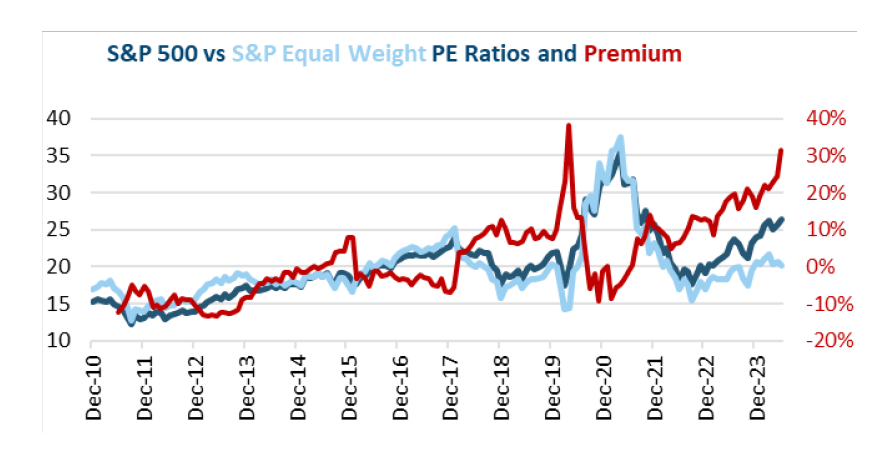
Chart 2
One reason to look at these other stocks is that the valuation issues that exist for the S&P 500 are concentrated as well. The S&P 500’s rally has stretched its valuation. However, just as with returns, higher valuations are also concentrated at the top of the market. Chart 2 shows the S&P 500 and S&P EW PE ratios, as well as the S&P 500’s premium to the S&P EW (in red, on the right-hand scale). Other than a brief distorted period around covid, the current gap of 26 versus 20, or 31%, is a record.
The challenge for investors is that recent performance, paired with an appealing narrative, makes it seem as if this small group of megacap stocks is the only thing worth owning. Yet at the same time, the S&P 500 vs EW performance and valuation gap suggests caution focusing on this one group and maintaining a diverse portfolio.
This is why It is Hard to Escape the Impact of the Narrow Market.
Important Disclosures:
Please remember that past performance is no guarantee of future results. Different types of investments involve varying degrees of risk, and there can be no assurance that the future performance of any specific investment, investment strategy, or product (including the investments and/or investment strategies recommended or undertaken by Grimes & Company, Inc. [“Grimes]), or any non-investment related content, made reference to directly or indirectly in this commentary will be profitable, equal any corresponding indicated historical performance level(s), be suitable for your portfolio or individual situation, or prove successful. Due to various factors, including changing market conditions and/or applicable laws, the content may no longer be reflective of current opinions or positions. Moreover, you should not assume that any discussion or information contained in this commentary serves as the receipt of, or as a substitute for, personalized investment advice from Grimes. No amount of prior experience or success should not be construed that a certain level of results or satisfaction if Grimes is engaged, or continues to be engaged, to provide investment advisory services. Grimes is neither a law firm, nor a certified public accounting firm, and no portion of the commentary content should be construed as legal or accounting advice. A copy of the Grimes’ current written disclosure Brochure discussing our advisory services and fees continues to remain available upon request or at www.grimesco.com. Please Remember: If you are a Grimes client, please contact Grimes, in writing, if there are any changes in your personal/financial situation or investment objectives for the purpose of reviewing/evaluating/revising our previous recommendations and/or services, or if you would like to impose, add, or to modify any reasonable restrictions to our investment advisory services. Unless, and until, you notify us, in writing, to the contrary, we shall continue to provide services as we do currently. Please Also Remember to advise us if you have not been receiving account statements (at least quarterly) from the account custodian. Historical performance results for investment indices, benchmarks, and/or categories have been provided for general informational/comparison purposes only, and generally do not reflect the deduction of transaction and/or custodial charges, the deduction of an investment management fee, nor the impact of taxes, the incurrence of which would have the effect of decreasing historical performance results. It should not be assumed that your Grimes account holdings correspond directly to any comparative indices or categories. Please Also Note: (1) performance results do not reflect the impact of taxes; (2) comparative benchmarks/indices may be more or less volatile than your Grimes accounts; and, (3) a description of each comparative benchmark/index is available upon request.
The information contained herein is based upon sources believed to be true and accurate. Sources include: Factset Research Systems Inc., Bureau of Economic Analysis, Bureau of Labor Statistics, Congressional Budget Office, Board of Governors of Federal Reserve System, Fred: Federal Reserve Bank of St. Louis Economic Research, U.S. Department of the Treasury
-The Standard & Poor’s 500 is a market capitalization weighted index of 500 widely held domestic stocks often used as a proxy for the U.S. stock market. The Standard & Poor’s 400 is a market capitalization weighted index of 400 mid cap domestic stocks. The Standard & Poor’s 600 is a market capitalization weighted index of 600 small cap domestic stocks.
-The NASDAQ Composite Index measures the performance of all issues listed in the NASDAQ stock market, except for rights, warrants, units, and convertible debentures.
-The MSCI EAFE Index (Europe, Australasia, Far East) is a free float-adjusted market capitalization index that is designed to measure the equity market performance of developed markets, excluding the US & Canada. The MSCI Emerging Markets Index is a free float-adjusted market capitalization index that is designed to measure equity market performance of 21 emerging markets. The MSCI All Country World Index is a free float adjusted market capitalization index designed to measure the performance of large and mid and cap stocks in 23 developed markets and 24 emerging markets. With over 2,800 constituents it represents over 85% of the global equity market.
-The Barlcays Aggregate Index represents the total return performance (price change and income) of the US bond market, including Government, Agency, Mortgage and Corporate debt.
-The BofA Merrill Lynch Investment Grade and High Yield Indices are compiled by Bank of America / Merrill Lynch from the TRACE bond pricing service and intended to represent the total return performance (price change and income) of investment grade and high yield bonds.
-The S&P/LSTA U.S. Leveraged Loan 100 is designed to reflect the largest facilities in the leveraged loan market. It mirrors the market-weighted performance of the largest institutional leveraged loans based upon market weightings, spreads and interest payments.
-The S&P Municipal Bond Index is a broad, comprehensive, market value-weighted index. The S&P Municipal Bond Index constituents undergo a monthly review and rebalancing, in order to ensure that the Index remains current, while avoiding excessive turnover. The Index is rules based, although the Index Committee reserves the right to exercise discretion, when necessary.
-The BofA Merrill Lynch US Emerging Markets External Sovereign Index tracks the performance of US dollar emerging markets sovereign debt publicly issued in the US and eurobond markets.
-The HFRI Fund of Funds index is compiled by the Hedge Funds Research Institute and is intended to represent the total return performance of the entire hedge fund universe.