

Shifting expectations on Federal Reserve policy has been a major market driver in the first half of 2024. The markets started the year with too optimistic an outlook on Fed rate cut expectations and had to adjust.
One way to assess the shifting Fed policy expectations is to compare the yield on the 1-month T-Bill today (a good measure of where Fed Funds currently are) to the 1-year forward rate, or where markets think the 1yr Treasury yield will be in 12 months. The 1-year forward rate is calculated by looking at the current 1yr and 2yr rate, then finding the rate that links them.
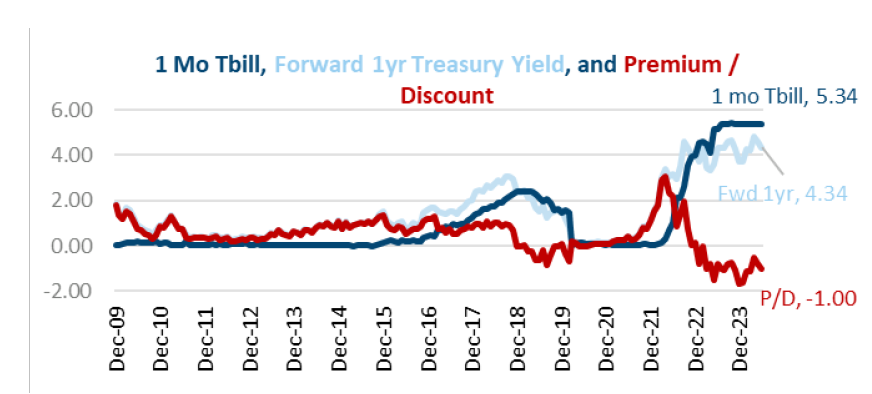
Chart 1
At the end of 2023, with the 1-month T-Bill at 5.40% and the forward 1-yr rate at 3.72%, the discount was a record 1.67%. Fast forward to 6/30/24, and that discount has declined to 1.00%, as the forward 1-year rate has risen to 4.34%. In other words, the market has gone from pricing 7 rate cuts (1.67% is approximately seven 25 bps rate cuts) by the end of 2024, to just four by June 2025. When the year started, the markets were looking for 6 or 7 rate cuts as the Fed said three. Now, markets are more in line with the Fed’s 1-2 2024 rate cuts. This shifting policy outlook has contributed to stock and bond market volatility, while making every inflation release, unemployment report, and Fed meeting a potential market moving event.
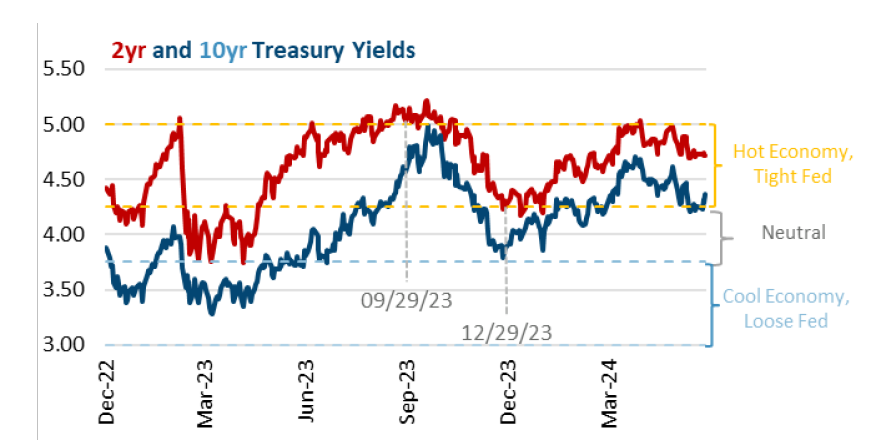
Chart 2
Rather than speculate about Fed policy, we look at what type of economy and Fed policy is priced into the markets, and then consider whether that is a reasonable outlook and thus if investors are being properly compensated. Assuming 2% inflation and 2% trend growth (the Fed’s two long term assumptions), we get a 4% neutral interest rate, with a 50 bps 3.75% to 4.25% neutral range. Second, we look at the 2yr yield as a proxy for Fed policy, and the 10yr yield as a proxy for the economy. Based on where the 2yr is relative to our neutral range, we can gauge the market’s view of Fed policy, while the 10yr shows what type of economy the market is pricing.
Chart 2 shows these two rates, as well as an orange “Hot Economy, Tight Fed” range of 4.25% to 5.00%, and a blue “Cool Economy, Loose Fed” range of 3.00% to 3.75%. The two highlighted dates show how this thought process can be beneficial.
We have swung from 9/29/23, where a tight Fed and hot economy were priced, to 12/29/23, when the market had shifted all the way to forecasting 6 or 7 rate cuts and a slowing economy. The 10yr had dropped to 3.88%, the bottom of the neutral range. At these levels, for investors to be compensated it would require the economy to enter a recession.
Thus far in 2024, stronger inflation readings to start the year pushed the 10yr as high as 4.75% and the 2yr to 5% (suggesting no rate cuts) in April. Subsequently, cooler inflation data has seen the 10yr reach the upper end of the “Neutral” range of 4.25%, while the lower 2yr suggests the market are starting to price a looser Fed again.
As of 6/29/24, the 4.37% 10yr is in line with a “soft landing” scenario of slower growth and less inflation, but no recession. Its vulnerable to stronger data, which would push rates back towards 5%. Conversely, since a recession would push rates below 4%, bonds could deliver positive returns in such a scenario. Meanwhile, the 4.72% 2yr is in line with one or two 2024 rate cuts, which is also a reasonable expectation. Combined, the bond market enters the second half of 2024 with a relatively balanced outlook as The Market Digests the Fed.
Important Disclosures:
Please remember that past performance is no guarantee of future results. Different types of investments involve varying degrees of risk, and there can be no assurance that the future performance of any specific investment, investment strategy, or product (including the investments and/or investment strategies recommended or undertaken by Grimes & Company, Inc. [“Grimes]), or any non-investment related content, made reference to directly or indirectly in this commentary will be profitable, equal any corresponding indicated historical performance level(s), be suitable for your portfolio or individual situation, or prove successful. Due to various factors, including changing market conditions and/or applicable laws, the content may no longer be reflective of current opinions or positions. Moreover, you should not assume that any discussion or information contained in this commentary serves as the receipt of, or as a substitute for, personalized investment advice from Grimes. No amount of prior experience or success should not be construed that a certain level of results or satisfaction if Grimes is engaged, or continues to be engaged, to provide investment advisory services. Grimes is neither a law firm, nor a certified public accounting firm, and no portion of the commentary content should be construed as legal or accounting advice. A copy of the Grimes’ current written disclosure Brochure discussing our advisory services and fees continues to remain available upon request or at www.grimesco.com. Please Remember: If you are a Grimes client, please contact Grimes, in writing, if there are any changes in your personal/financial situation or investment objectives for the purpose of reviewing/evaluating/revising our previous recommendations and/or services, or if you would like to impose, add, or to modify any reasonable restrictions to our investment advisory services. Unless, and until, you notify us, in writing, to the contrary, we shall continue to provide services as we do currently. Please Also Remember to advise us if you have not been receiving account statements (at least quarterly) from the account custodian. Historical performance results for investment indices, benchmarks, and/or categories have been provided for general informational/comparison purposes only, and generally do not reflect the deduction of transaction and/or custodial charges, the deduction of an investment management fee, nor the impact of taxes, the incurrence of which would have the effect of decreasing historical performance results. It should not be assumed that your Grimes account holdings correspond directly to any comparative indices or categories. Please Also Note: (1) performance results do not reflect the impact of taxes; (2) comparative benchmarks/indices may be more or less volatile than your Grimes accounts; and, (3) a description of each comparative benchmark/index is available upon request.
The information contained herein is based upon sources believed to be true and accurate. Sources include: Factset Research Systems Inc., Bureau of Economic Analysis, Bureau of Labor Statistics, Congressional Budget Office, Board of Governors of Federal Reserve System, Fred: Federal Reserve Bank of St. Louis Economic Research, U.S. Department of the Treasury
-The Standard & Poor’s 500 is a market capitalization weighted index of 500 widely held domestic stocks often used as a proxy for the U.S. stock market. The Standard & Poor’s 400 is a market capitalization weighted index of 400 mid cap domestic stocks. The Standard & Poor’s 600 is a market capitalization weighted index of 600 small cap domestic stocks.
-The NASDAQ Composite Index measures the performance of all issues listed in the NASDAQ stock market, except for rights, warrants, units, and convertible debentures.
-The MSCI EAFE Index (Europe, Australasia, Far East) is a free float-adjusted market capitalization index that is designed to measure the equity market performance of developed markets, excluding the US & Canada. The MSCI Emerging Markets Index is a free float-adjusted market capitalization index that is designed to measure equity market performance of 21 emerging markets. The MSCI All Country World Index is a free float adjusted market capitalization index designed to measure the performance of large and mid and cap stocks in 23 developed markets and 24 emerging markets. With over 2,800 constituents it represents over 85% of the global equity market.
-The Barlcays Aggregate Index represents the total return performance (price change and income) of the US bond market, including Government, Agency, Mortgage and Corporate debt.
-The BofA Merrill Lynch Investment Grade and High Yield Indices are compiled by Bank of America / Merrill Lynch from the TRACE bond pricing service and intended to represent the total return performance (price change and income) of investment grade and high yield bonds.
-The S&P/LSTA U.S. Leveraged Loan 100 is designed to reflect the largest facilities in the leveraged loan market. It mirrors the market-weighted performance of the largest institutional leveraged loans based upon market weightings, spreads and interest payments.
-The S&P Municipal Bond Index is a broad, comprehensive, market value-weighted index. The S&P Municipal Bond Index constituents undergo a monthly review and rebalancing, in order to ensure that the Index remains current, while avoiding excessive turnover. The Index is rules based, although the Index Committee reserves the right to exercise discretion, when necessary.
-The BofA Merrill Lynch US Emerging Markets External Sovereign Index tracks the performance of US dollar emerging markets sovereign debt publicly issued in the US and eurobond markets.
-The HFRI Fund of Funds index is compiled by the Hedge Funds Research Institute and is intended to represent the total return performance of the entire hedge fund universe.